There are many chart patterns in the world of technical analysis. Some are more effective than others. Some occur with more frequency. They are used to help determine potential price movements. These are widely used as a tool by most successful investors. The patterns can visually differ but it is important to understand the price movements within them. There are two types of patterns: Reversal patterns and Continuation patterns. The most effective ones only serve one purpose. We will work to explain and give examples of the common occurring patterns.
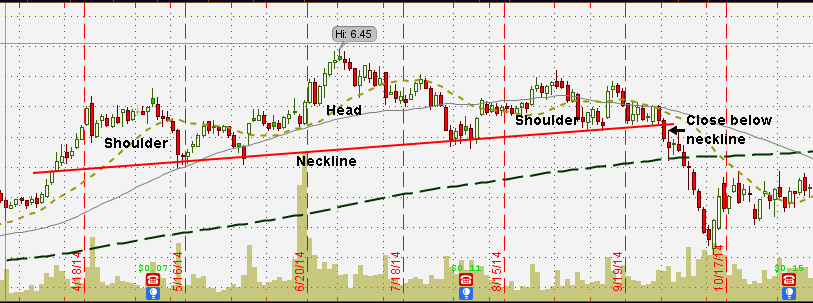
Head and Shoulder Pattern – A head and shoulder pattern is a bearish reversal pattern.
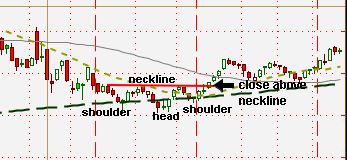
Inverse Head and Shoulder Pattern – An inverse head and shoulder pattern is a bullish reversal pattern or bullish continuation pattern.
Ascending (Asymmetric) Triangle – An ascending triangle pattern is a bullish continuation pattern.
Descending Triangle – A descending triangle pattern is a bearish continuation pattern.
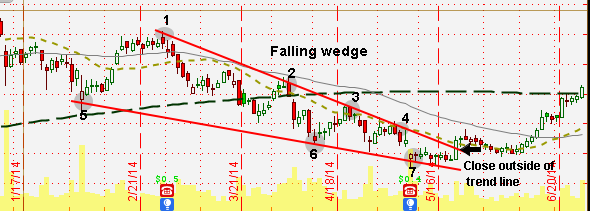
Falling Wedge – A falling wedge is a bullish reversal pattern.
Rising Wedge – A rising wedge is a bearish reversal pattern.
Cup and Handle pattern – A cup and handle pattern is a bullish reversal pattern or a bullish continuation pattern
Double Top pattern – A double top pattern is a bearish reversal pattern.
Double Bottom pattern – A double bottom pattern is a bullish reversal pattern.
Diamond pattern – A diamond pattern is a bullish continuation pattern.
Chart patterns happen on all chart time frames. We find them to be more effective when they occur on the year chart. Majority of the chart patterns need at least 4 weeks to develop. The key to their effectiveness is confirmation. While they can be an effective tool, they can also fail to be confirmed. With the combination of tools we provide, we show how to increase the probability of executing a winning trade.
